I Got Tired of Checking 12 App Revenue, So I Built My Own Dashboard
I Got Tired of Checking 12 App Revenue, So I Built My Own Dashboard
목차 (10)
- Whats the Problem with App Store Connect?
- I Threw the Requirements at Claude
- Connecting the App Store Connect API — JWT Authentication Was the First Wall
- Vercel Cron Automation — Data Piles Up While I Sleep
- Whats Inside the Dashboard
- How the Data Gets Stored
- The App Works for Me Now
- If Its Tedious, Just Build It
- FAQ
- Wrapping Up
March 2026 · Lazy Developer EP.02
I have 12 apps on the App Store. It started with one. One becoming two was natural. Two becoming five was ambition. Five becoming twelve was the result of not stopping. Having more apps isn’t bad — the problem is that the number of things to check grows at the same rate.
I built a dashboard that shows all 12 apps’ revenue, downloads, and keyword rankings on a single screen. I named it Apsity. I connected the App Store Connect API and set it up to pull data automatically every night. This post is the dev journal of that process.
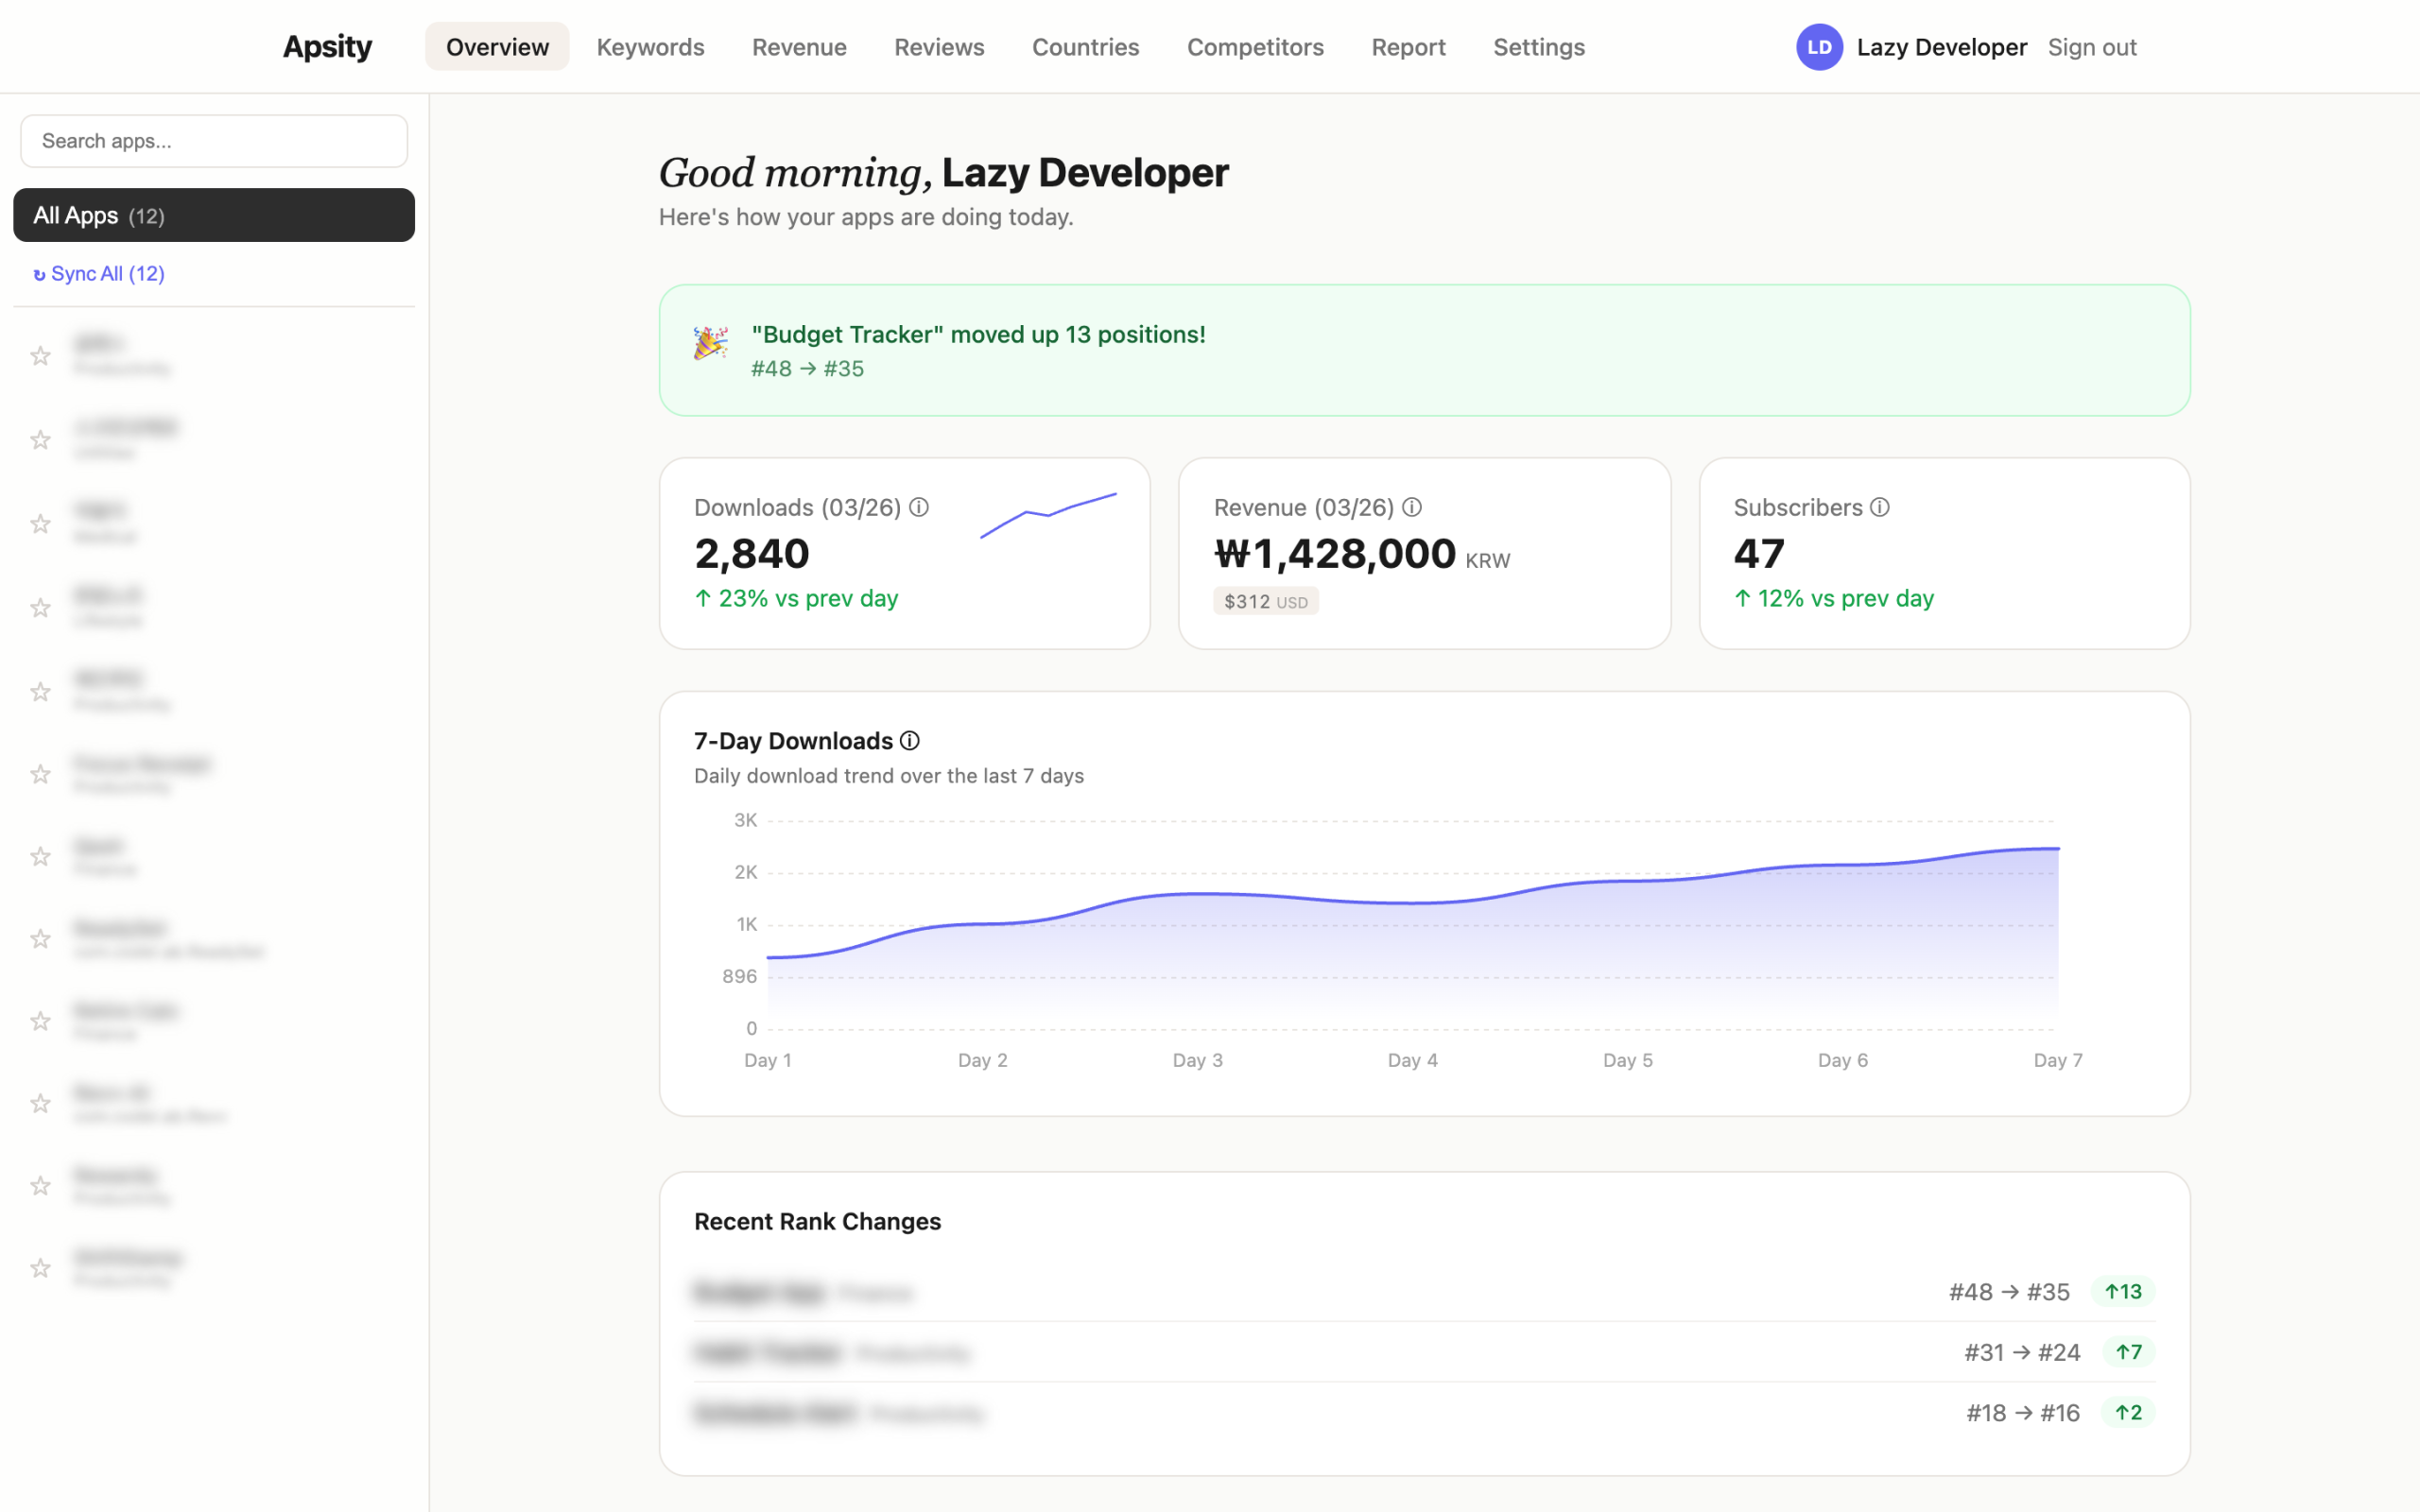
The dashboard I built — data from all 12 apps on one screen / GoCodeLab
– App Store Connect’s Sales and Trends aggregation is being deprecated between 2026–2027
– Decided to build my own data pipeline before it disappears
– Threw two lines of requirements at Claude and locked in the Next.js + Supabase + Vercel architecture
– Connected the App Store Connect API with JWT authentication, parsed TSV data
– Vercel Cron auto-syncs at 3 AM daily, after() pattern handles 12 apps in parallel
– Now when I wake up, yesterday’s data is already there
What’s the Problem with App Store Connect?
Let me clear something up first. App Store Connect’s Sales and Trends does let you view aggregated data across all your apps. As of now, you can see Units, Proceeds, and Sales bundled for all apps. No need to click into each one — the totals are right there. So saying “ASC can’t aggregate” would be wrong today.
The problem is that this is about to go away. In March 2026, Apple announced a major Analytics overhaul and said they’re phasing out the Sales and Trends dashboard. Subscription dashboards start disappearing mid-2026, and the rest follows through 2027. The new Analytics comes with over 100 per-app metrics — cohort analysis, peer benchmarks, subscription data. But the ability to view multiple apps aggregated on a single screen? Gone.
John Voorhees at MacStories nailed it: “There will no longer be a single place to see aggregated performance across multiple apps.” Steve Troughton-Smith put it as “App Store Connect had a big scary overhaul and now everything is in the wrong place.” Apple acknowledged the feedback about cross-app reporting, but acknowledging and fixing are two different things.
I decided to build my own before it all disappears. What I wanted was more specific than what ASC offered anyway. Not just aggregated numbers — I wanted keyword ranking, competitor tracking, and AI analysis, all in one place. The aggregated dashboard was the most urgent piece, so I started there.
I Threw the Requirements at Claude
I didn’t architect this alone. I opened a fresh Claude session and just wrote what I needed. “I’m a developer running multiple iOS apps and I want to see revenue on a single screen. App Store Connect API integration. Keyword ranking.” Two lines.
Claude came back with a stack proposal. Here’s what it suggested.
Framework: Next.js — builds the frontend and backend in one package
DB: Supabase — cloud database with real-time sync, like a spreadsheet but smarter
Auth: Supabase Auth — handles login/session management automatically
Deploy: Vercel — push code and it’s live on the internet, with built-in timers
Charts: Recharts — a library for rendering graphs and charts
By the first evening, the basic structure was in place. Things moved so fast that I actually had to make more decisions, not fewer. Claude recorded those decisions in CLAUDE.md. Even when sessions were interrupted, context like “why we recreated the Supabase project in US East instead of the India region” was preserved. The automation I built in EP.01 paid off right here.
Connecting the App Store Connect API — JWT Authentication Was the First Wall
You can’t just access the App Store Connect API. You have to generate a JWT token yourself. JWT is like a digital ID card that proves “I’m really the developer.” You sign it with a private key issued by Apple, include an expiration time, and match Apple’s exact encryption method (ES256). Reading about it makes sense, but when you actually build it, something always goes wrong.
I handed Claude the Apple documentation link and said, “Generate this JWT in TypeScript.” I pasted the code it returned, ran it, and the first API call went through. A response came back. In TSV format. TSV is a text file with tab-separated columns — like a spreadsheet but in plain text. When that wall of text hit my terminal, I knew it was just data, but it still felt good. Something was connected.
The next problem was parsing that data. The sales report has dozens of columns. The key one is a field called productType — a single number. 1 means download, 7 means in-app purchase, 8 means subscription. Apple uses this number to classify transaction types. If you scatter this logic throughout your code, you’ll have to hunt down every instance when Apple changes the spec. Claude suggested creating a single classification function called categorize(). All type detection goes through this one function, and the rest of the code just reads the result. It still runs that way today.
Revenue aggregation across countries is trickier than it sounds. Sales in Korea come in KRW, sales in Japan come in JPY. If you convert manually using exchange rates, yesterday’s revenue might look lower than today’s just because of currency fluctuation. Apple already provides a USD-converted value in the proceeds field. Claude suggested aggregating only that value. Consistent dollar-based trends with no exchange rate distortion. Made sense, so I used it as-is.
Vercel Cron Automation — Data Piles Up While I Sleep
The API was connected. I could read the data. Now I needed this to run automatically every day. Vercel has a feature called Cron. Like a smartphone alarm — you set “run this at this time every day” and it handles the rest.
“/api/cron/daily-sync” → Every day at 3 AM KST (UTC 18:00)
“/api/cron/daily-rank” → Every day at 3:30 AM — keyword ranking collection
“/api/cron/cleanup” → Weekly — auto-purge old data
3 AM in Korea is 18:00 UTC. I timed it for when the previous day’s data is finalized. The first night after deploying, I checked the Vercel logs from bed. The Cron had run, the API had been called, and data was sitting in Supabase. When I opened the dashboard that morning, yesterday’s download numbers were already there. I hadn’t done anything, but the data was there. That feeling was stranger than I expected. In a good way.
Then a problem appeared. With 12 apps, the sync job needs to run 12 times. Vercel Cron kills any job that doesn’t finish within 10 seconds. Processing them one by one takes over 20 seconds. If it gets cut off at 10 seconds, the remaining apps don’t get synced.
I explained the situation to Claude, and it suggested the next/server after() pattern. Like a cashier at a convenience store saying “thank you” the moment payment is done, then printing the receipt afterward — respond first, then process in the background.
export async function GET() {
after(async () => {
await Promise.all(apps.map(app => syncApp(app)))
})
return NextResponse.json({ ok: true }) // Respond immediately before timeout
}
It returns “job complete” instantly. From Vercel’s perspective, a response came back, so no timeout. The actual sync runs in the background inside after(). All 12 apps start at the same time. Like opening 12 bank teller windows at once instead of making 12 people wait in a single line. Applied it, and the timeout was gone.
What’s Inside the Dashboard
Here’s what the finished product looks like. When you open the dashboard, the first thing you see is four metric cards: total downloads today, total revenue (USD), active subscribers, and best keyword ranking. Each card has a small 7-day trend graph inside it.
Scroll down and there’s a per-app performance table. App name, yesterday’s downloads, yesterday’s revenue — all in one row, sorted by revenue descending. The Revenue tab shows a stacked chart over 30 days with app sales, in-app purchases, and subscriptions color-coded. The Keywords tab shows a scatter plot of keyword rank vs. difficulty. X-axis is difficulty, Y-axis is rank. Upper-left quadrant is the sweet spot — low difficulty, high rank.
const opportunity = (1 – difficulty/100) * (200 – rank) / 2
// difficulty = based on rating counts of the top 10 apps for that keyword
// fewer ratings means indie apps can break through
if (score >= 70) → ‘Hard’
if (score >= 40) → ‘Medium’
else → ‘Easy’
I also built a competitor tracking tab. Register up to 5 apps in the same category, and it compares their metadata changes (name, subtitle, description) daily. The Countries tab shows which countries are driving download growth. The Subscriptions tab shows active subscriber counts and renewal rates. Some of this overlaps with what ASC’s new Analytics provides per-app. The difference is seeing all 12 of my apps in one place.
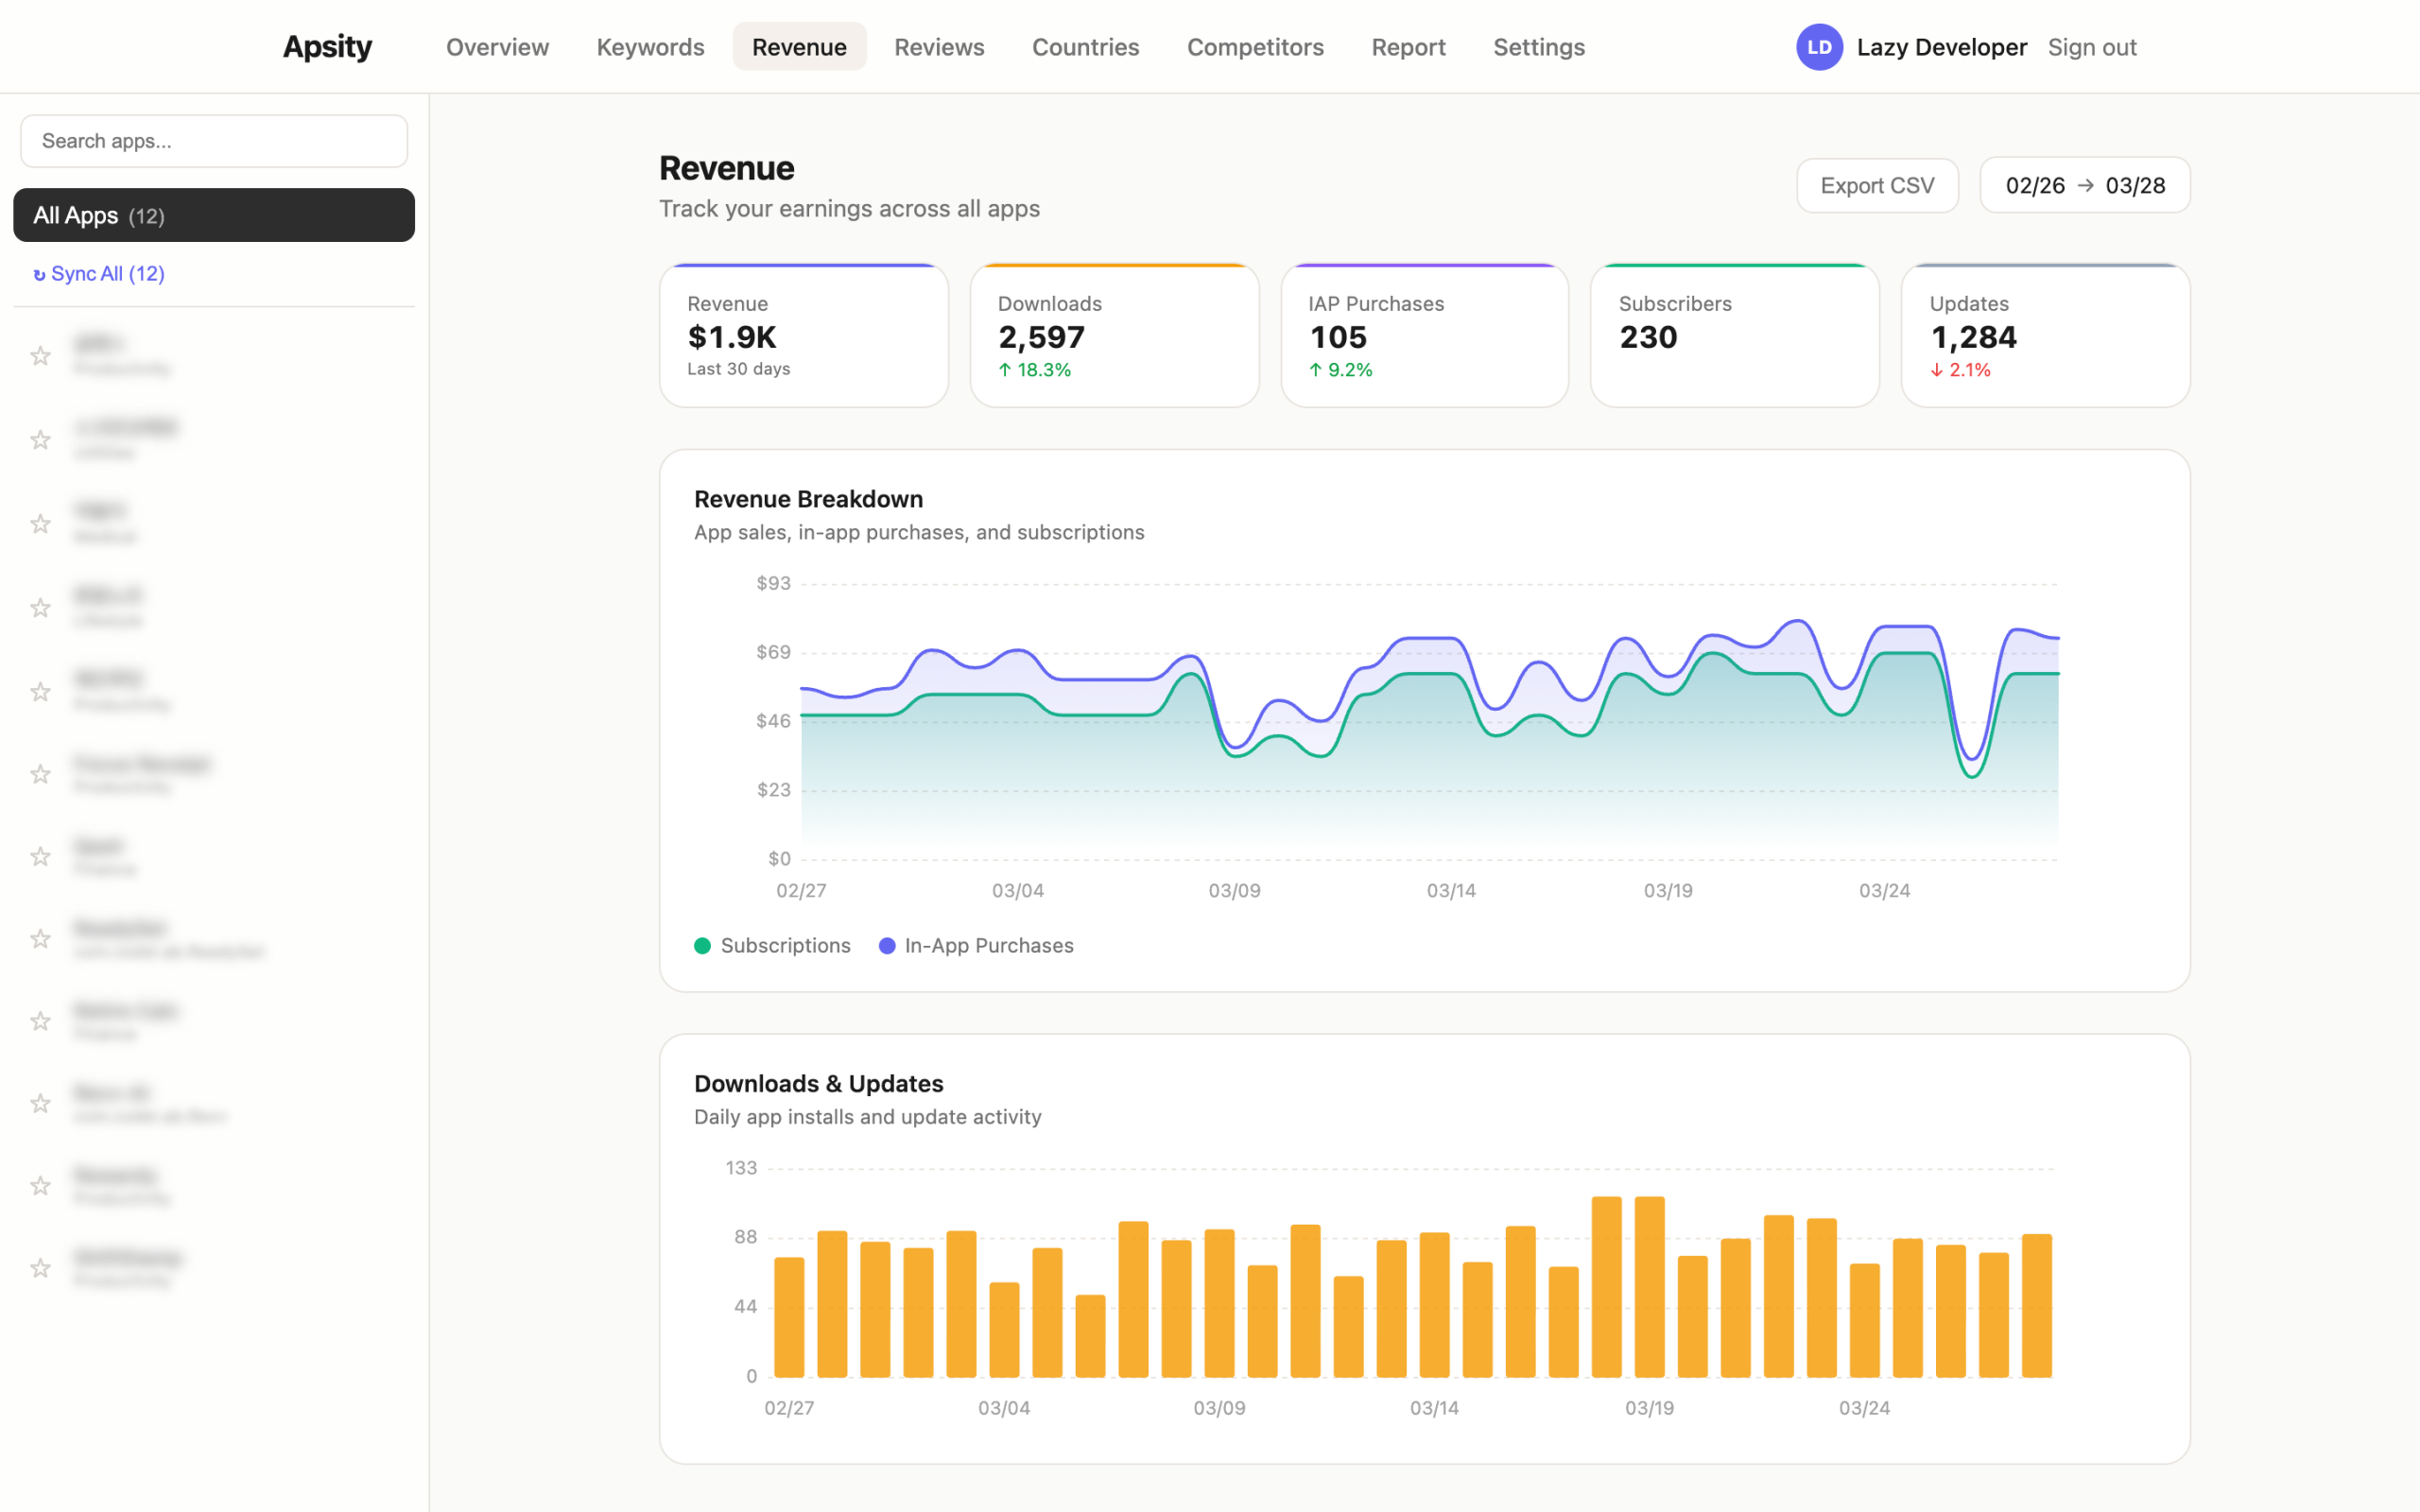
Revenue tab — 30 days of revenue auto-aggregated by type / GoCodeLab
How the Data Gets Stored
Data started flowing in daily as the Cron ran. But accumulating data creates new problems. DB costs go up, old data rarely gets looked at, and cleaning it up manually is yet another chore I don’t want. That’s where the cleanup Cron came from. Every Sunday at dawn, it automatically deletes data beyond a certain age. Claude suggested this one first. On my own, I probably wouldn’t have thought about it until the data had piled up for months.
Keyword ranking collection had its own quirks. If you call the iTunes Search API too fast inside a loop, you get hit with 429 (rate limit). I fixed it by adding a 300ms delay between requests. ASC data also has occasional delays — yesterday’s data might not be available at 3 AM. I added retry logic so it tries again 6 hours later if the data isn’t ready.
This is the part where vibe coding isn’t just “Claude writes code so it’s fast.” It catches future pain points early. Cleanup Cron, rate limit protection, retry logic — I would have only built these after something broke if I’d been working alone.
The App Works for Me Now
Here’s how Apsity runs today. Every day at 3 AM KST, the Cron calls the App Store Connect API. Downloads, revenue, and country-level data from the previous day land in Supabase. 30 minutes later, keyword rankings are collected. When I open the dashboard in the morning, all 12 apps’ data from the day before is already there. Aggregation is automatic. Ranking changes are visible immediately.
It took a few days to build. After that, I got back 15 minutes every morning. 15 minutes times 365 days is 91 hours. 91 hours is enough to build the next app. And when Apple finally sunsets Sales and Trends, there will be no way to see cross-app aggregation in ASC. Having my own pipeline before that happens is the right call.
If It’s Tedious, Just Build It
There’s a pattern that keeps repeating throughout this series. If something is tedious, build a solution. Right now, building things is a lot less tedious than it used to be. Even if terms like JWT, Cron, and after() feel unfamiliar, it doesn’t matter. Ask Claude “what is this and how do I use it?” and it explains and writes the code. Hand it a link to official docs and it reads them and implements. When the timeout issue came up, I just described the situation and the fix appeared. My job is judgment — is this the right direction? Does this approach fit our situation?
After building Apsity, the next tedious thing appeared. The dashboard showed data, but the question “so what should I do?” remained. The numbers were going down, sure, but figuring out why was still on me. In EP.03, I talk about the AI growth agent that automates even that judgment.
FAQ
Q. Can’t you already see aggregated revenue across all apps in App Store Connect?
Yes. Currently, Sales and Trends does support cross-app aggregation. But Apple announced they’re phasing out Sales and Trends starting mid-2026. The new Analytics only supports per-app analysis — cross-app aggregation is missing. It works now, but it won’t for long. I built my own pipeline before it disappears.
Q. Isn’t connecting the App Store Connect API difficult?
It’s unfamiliar at first. You need JWT token generation, ES256 signing, and TSV parsing. But give Claude the Apple documentation link and it writes the code right away. Half a day and the API connection was working. Much faster than digging through the docs yourself.
Q. Do you need coding skills to build an app with vibe coding?
Having a clear idea of what you want matters more than coding skills. If you can describe what you want to build in plain language, Claude handles a significant portion. Making judgment calls and setting the direction is still on you.
Q. Can you automate Cron jobs on Vercel’s free plan?
Yes. The free plan has a short timeout, but if you use the after() pattern — respond immediately and process in the background — you can sync all 12 apps without hitting the timeout.
Q. Wouldn’t it be better to just use an existing ASO tool instead of building your own?
Depends on what you need. Tools like Sensor Tower or AppFollow are feature-rich but can be expensive for indie developers. If you want exactly the features you need and nothing more, building your own can make sense. And the process of building it is a learning experience in itself.
Wrapping Up
I built the dashboard, and data flows in automatically every night. The morning routine of juggling 12 App Store Connect tabs is gone. And when Apple eventually sunsets Sales and Trends, my data pipeline will keep running as if nothing happened.
But after using the dashboard for three days, a different kind of frustration appeared. The numbers were there, but “so what should I do?” lingered. I talk about that in EP.03.
This post was written in March 2026. Content may be updated.
Related: Lazy Developer EP.01 · Lazy Developer EP.03 — AI Growth Agent