The Dashboard Was There but I Didn’t Know What to Do, So I Let AI Handle It
The Dashboard Was There but I Didn’t Know What to Do, So I Let AI Handle It
On this page (12)
- What existing tools dont tell you — and the price tag
- AI Growth Agent — a system that makes judgments for you
- Why I added confidence badges
- Indie app filter — wrong comparisons make analysis useless
- Competitors menu — checking every day if someone changed something yesterday
- Plugging Claude API into Apsity for the second time — in the Keywords menu
- Adaptive growth stage mode — from SEED to STABLE
- Claude reviewed my code
- Weekly email report — a summary arriving Monday at 8 AM
- First run — 48 insights
- FAQ
- After the dashboard
March 2026 · Lazy Developer EP.03
I had a dashboard. Built it in EP.02. Every day at 3 AM, a Cron job runs. By morning, all of yesterday’s data for 12 apps is there. Downloads total, revenue, keyword rankings. Everything on one screen. It took days to build, and it saved me 15 minutes every morning.
But about three days in, a different kind of question lingered. “The finance app downloads dropped 22% today.” The number was right there on screen. So what? I didn’t know why it dropped. I didn’t know what to do about it. The dashboard showed me what happened. The judgment was still on me. Having a dashboard actually made things more tiring in a way — the decisions I needed to make became painfully clear.
So I decided to automate the judgment part too. I built an AI growth agent inside Apsity. That’s what this post is about.
– Dashboard shows “what happened,” but “why” and “what to do” were still on me
– Designed 5 analysis patterns: rank drop diagnosis, hidden markets, keyword optimization, review analysis, revenue breakdown
– Confidence badge on every insight: Fact / Correlation / Suggestion
– Indie app filter excludes enterprise apps (1,000+ ratings), analyzes only comparable apps
– Second Claude API integration — auto-generates 100-character keyword sets, suggests app names, extracts insights
– Auto growth stage detection: SEED -> GROWING -> STABLE
– Weekly email report added: Monday 8 AM, auto-sent via Resend + React Email
– First run: 12 apps, 48 insights generated automatically
What existing tools don’t tell you — and the price tag
There are plenty of App Store analytics tools out there. AppFollow, Sensor Tower, MobileAction, plus App Store Connect itself. They all do the same thing. “3,240 downloads this week.” “Keyword ranking change: -5.” Numbers showing what happened.
The pricing tells the story. Sensor Tower’s enterprise plan starts at $30,000/year. You can negotiate it down a bit, but it’s not an indie developer price. AppFollow has a $39/month basic plan, but it caps at 5 apps. Managing 12 means upgrading, and the cost jumps. So most indie developers end up using App Store Connect’s (ASC) built-in analytics.
ASC has its own problems. In January 2026, IAP revenue suddenly displayed as zero — a bug. Real revenue was coming in, but the screen showed 0. The March 2026 update added over 100 new metrics, but there’s still no way to view multiple apps on one screen. With 12 apps, you have to check 12 separate pages. That’s why I built my own dashboard in EP.02.
No matter which tool you use, the “so what?” question remains. Why did it drop? Did a competitor change something? Is my keyword the problem? Is there a signal in the reviews? To figure that out, you have to dig through the data yourself. The tools don’t dig for you.
What I wanted was different. Give it data, and it tells me the cause. If there’s a cause, it tells me what to do. If it knows what to do, it gives me something I can use right now. Not “you might want to change your keywords” but “copy this 100-character set and paste it into your App Store keyword field.”
AI Growth Agent — a system that makes judgments for you
I wrote up my requirements and handed them to Claude. “Not just showing what happened — diagnose the cause, provide verifiable evidence, and deliver ready-to-use outputs.” It was a one-line description. Claude broke it into 5 analysis patterns.
1. Rank Drop Diagnosis — Why it dropped, including competitor changes
2. Hidden Market Discovery — Keywords where my app isn’t showing but opportunities exist
3. Keyword Optimization — Current keyword analysis + auto-generated 100-char optimal set
4. Review Keyword Analysis — Recurring patterns extracted from user reviews
5. Revenue Breakdown — Subscription vs IAP anomaly detection + cause hypotheses
Patterns alone are meaningless. What matters is how trustworthy each result is. Not everything AI says is fact. Something read directly from data, something inferred from patterns, and something AI suggests — these are fundamentally different. Without distinguishing them, you’d treat inferences as facts.
Why I added confidence badges
I attached a confidence badge to every insight card. There are three types.
Each card also has a [View Evidence] toggle. Click it, and you see the raw data: “34% drop from 7-day download average, competitor A changed 3 metadata fields in the same period.” You can check what data the AI used to produce the insight. So you can judge for yourself whether to trust it.
This is a design decision, but it’s also a philosophy. You shouldn’t just follow what AI says. You should be able to see why it said it. That way, you’ll know when it’s wrong, too.
Indie app filter — wrong comparisons make analysis useless
While designing the competitive analysis, I hit a problem. Even within the same category, some apps shouldn’t be compared. Official apps from major banks, apps from companies like Naver or Kakao. They have different marketing budgets, different ASO strategies, and hundreds of thousands of ratings. If an indie developer gets compared against them by the same standards, no meaningful insight comes out.
I asked Claude, and it suggested a rating-count filter. Apps with 1,000+ ratings get classified as enterprise and excluded from comparisons. Apps with 50-1,000 ratings get classified as indie successes and used as the comparison baseline. It seems obvious in hindsight, but thinking of this during the design phase would have taken me much longer on my own.
Competitors menu — checking every day if someone changed something yesterday
After designing the indie filter, I built the Competitors menu. The feature itself is straightforward. But in practice, it became the page I opened most often.
Here’s how it works. Once you register a competitor, a Cron job calls the iTunes Lookup API every day at 4 AM KST (UTC 19:00) to fetch that app’s latest metadata. App name, subtitle, description, icon, version. These five fields get saved to CompetitorSnapshot daily, compared against the previous day, and any changes get logged to the MetaChange table.
Open the menu and you see the list of registered competitors. Apps with recent metadata changes rise to the top, showing which fields changed. Click on a changed field to see the previous and current versions side by side. Whether the icon changed, how the description text evolved — all visible as a text diff.
There are three tabs in the menu. Besides the change history tab, there’s a keyword ranking comparison tab. You can compare where competitors rank for the keywords you’re tracking, broken down by country. Nine countries are supported (Korea, US, Japan, UK, Germany, etc.). The reviews tab lets you read competitors’ latest reviews directly. Reading what their users complain about sometimes gives direction for my own app updates.
At first I thought, “Does this even matter?” So a competitor changed their description — what can I do about it? Using it changed my mind. Three competitors of my finance app updated their descriptions and keywords on the same day, and my ranking dropped right after. The MetaChange log had the dates and exact changes. It’s correlation, not causation, but without this data, tracking down the cause would have taken much longer.
This is where the case for automation becomes clear. Manually checking dozens of competitors on the App Store every day is physically impossible. You just stop doing it. But when Cron scrapes daily and flags changes, I can see what changed yesterday in under 30 seconds. You build it because you’re lazy. And once it’s built, you actually do it.
Plugging Claude API into Apsity for the second time — in the Keywords menu
I’d already connected Claude API to Apsity in EP.02. That was for short weekly focus suggestions based on app data. This time I added two more specific features. Auto-generating an optimal 100-character keyword set, and suggesting app names and subtitles based on indie success patterns. Both features live right inside Apsity’s Keywords menu. I didn’t split them into a separate page. While managing keywords, you can get AI suggestions and copy them immediately.
// App name, category, current keywords -> Claude -> 100-char optimal keyword set
const prompt = `
App: ${appName} (${category})
Current keywords: ${currentKeywords}
Top indie app keyword patterns: ${indiePatterns}
Generate an optimized keyword set within 100 characters for the App Store keyword field.
Remove duplicate words, separate with commas, no spaces after commas.`
There are rules for the keyword field. I made sure Claude knew them first. No space after commas (even one space counts toward the character limit), no plurals (App Store auto-matches from singular), no duplicating the app name or category name (they’re already indexed from separate fields), fill all 100 characters (empty space = wasted exposure). Words that frequently appear in reviews also function as keyword signals, so including repeated keywords extracted from review text helps.
budget,expense,tracker (a single space counts toward the limit)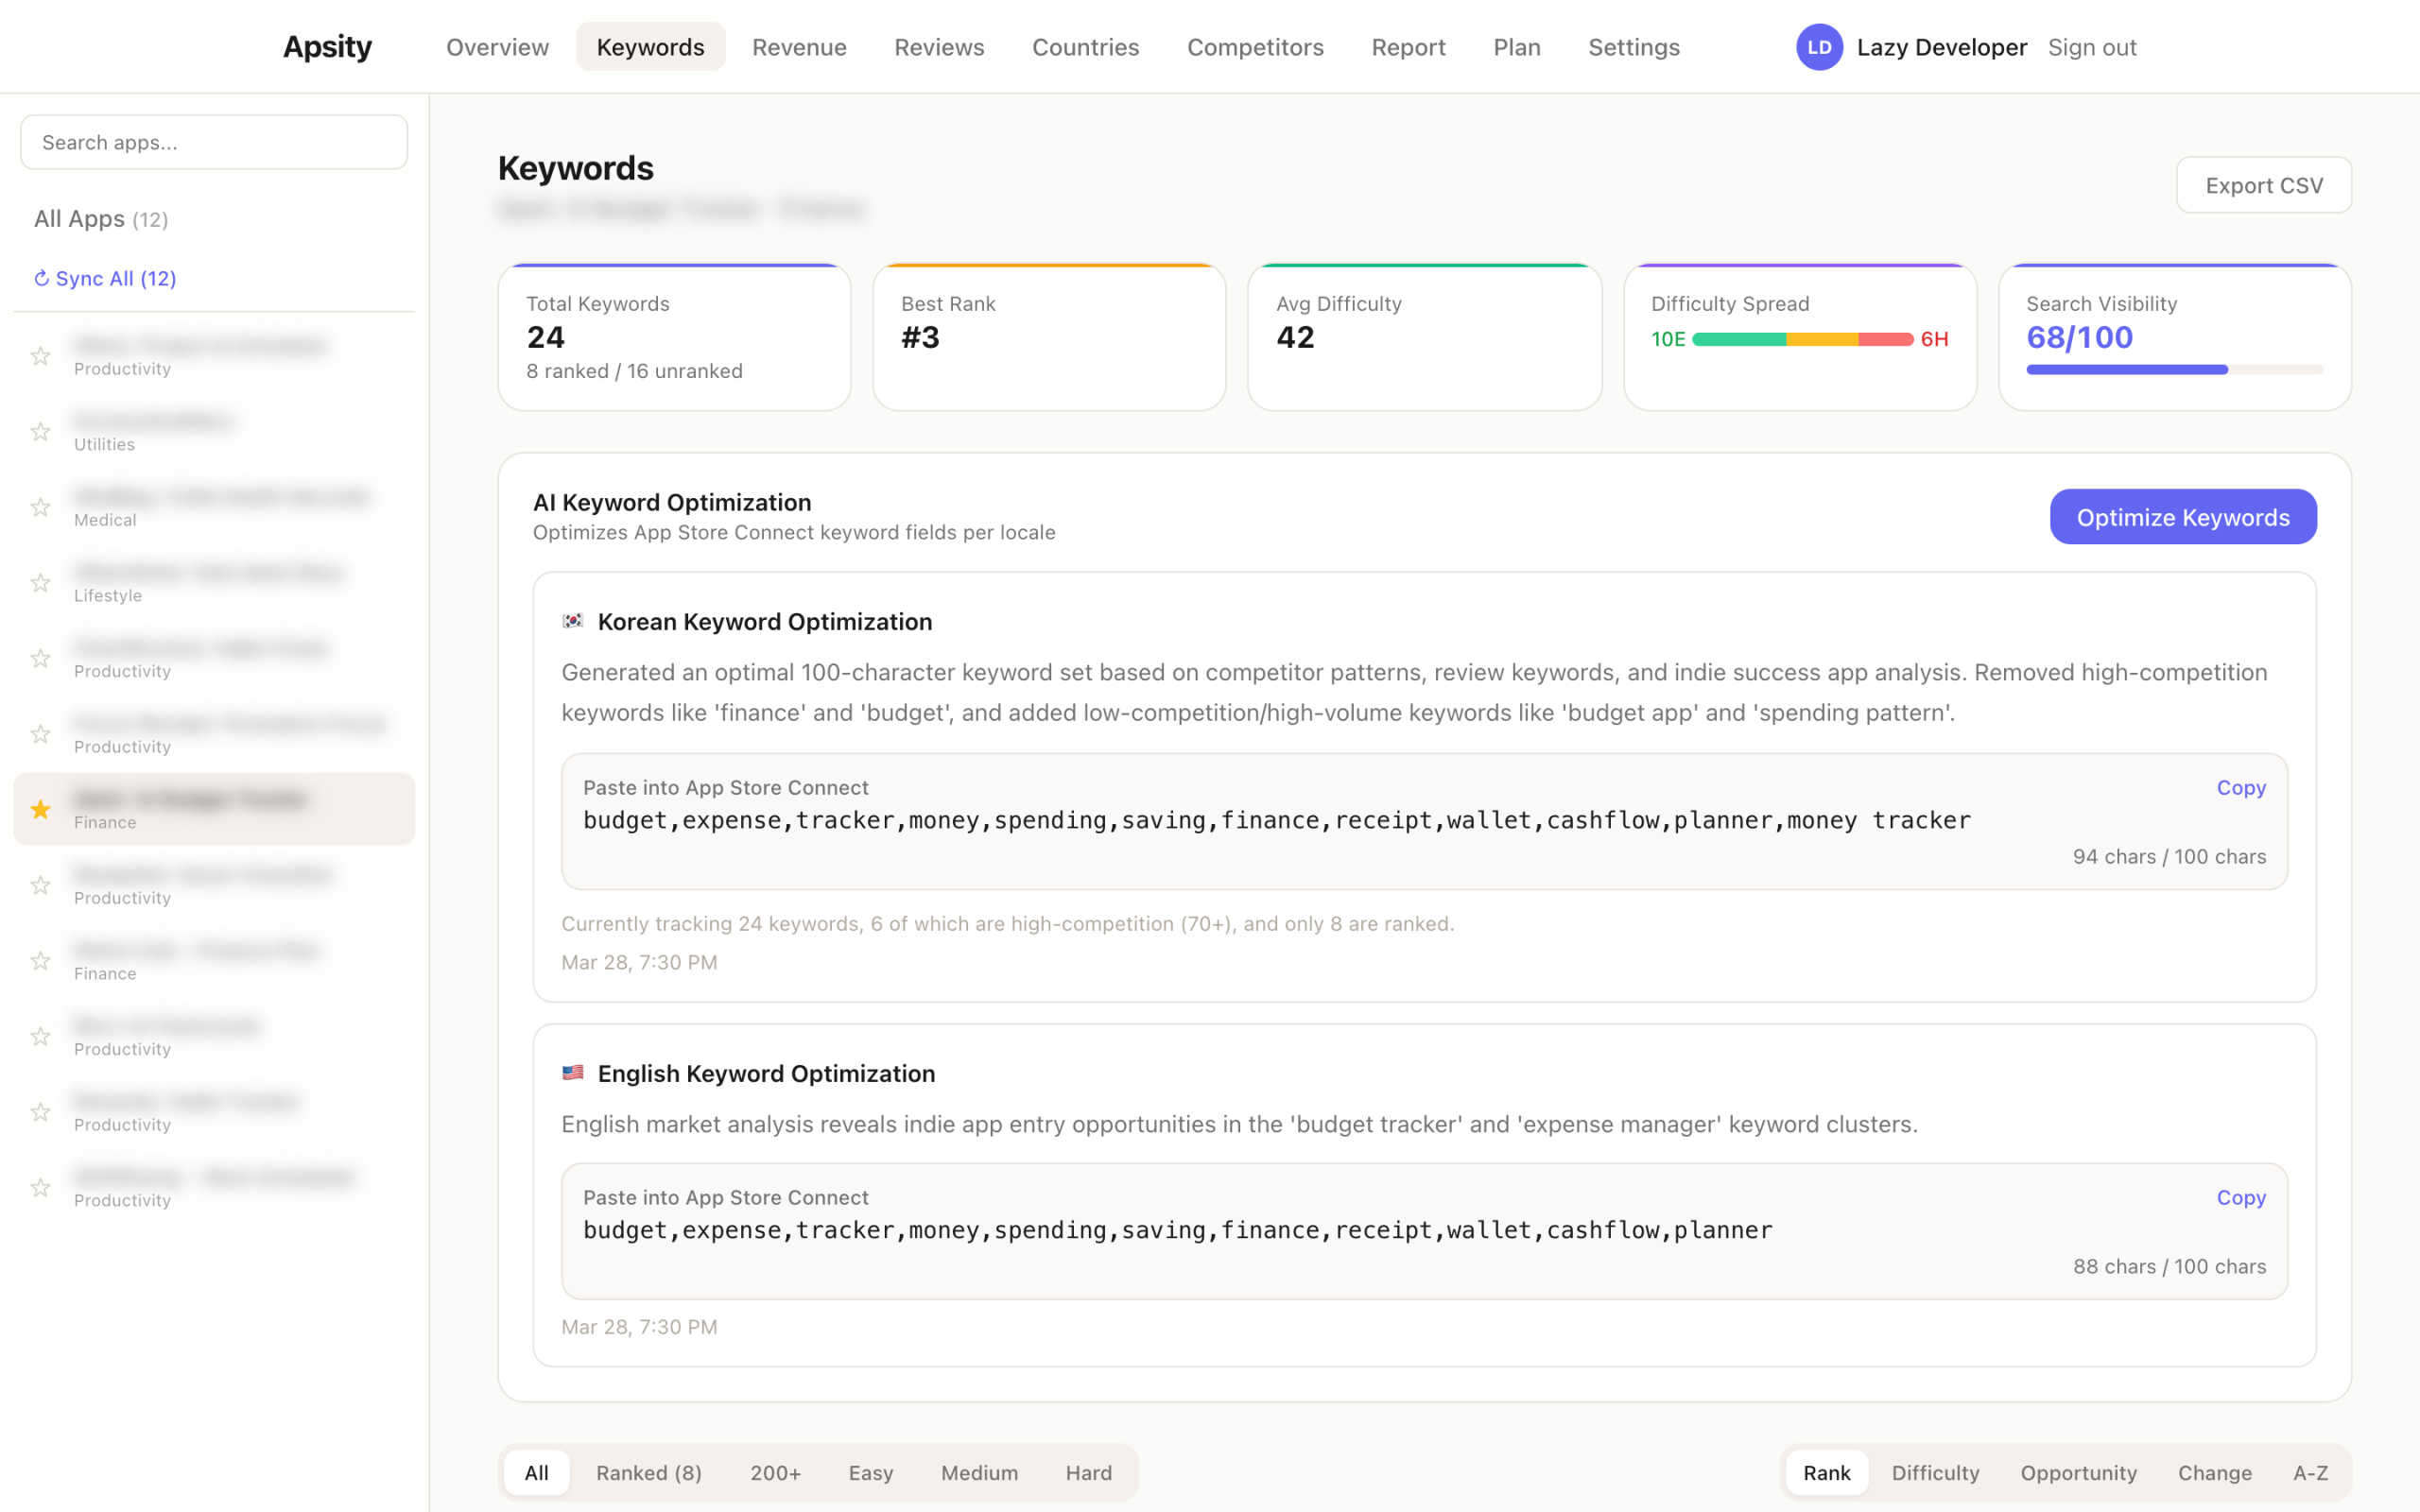
When Claude generates the keywords, a copy button appears on the result card. One click and it’s on your clipboard, formatted and ready to paste into the App Store Connect keyword field. Not “try changing your keywords to something like this” but “copy this and paste it.” There’s a difference between advice and deliverables.
App name suggestions work the same way. It analyzes name patterns from successful indie apps — short, function is clear, search keywords included — and suggests alternatives for your current app name based on those extracted patterns. Whether to use them is my call. But having options is better than having none.
Adaptive growth stage mode — from SEED to STABLE
After building all the analysis features, one problem became obvious. Running “revenue anomaly detection” on a freshly launched app is pointless. There’s no data. On the flip side, only running basic keyword generation for a well-established app is a waste. Each app is in a different situation. Running the same analysis on all of them doesn’t work.
I explained this problem to Claude, and it proposed auto-detecting growth stages.
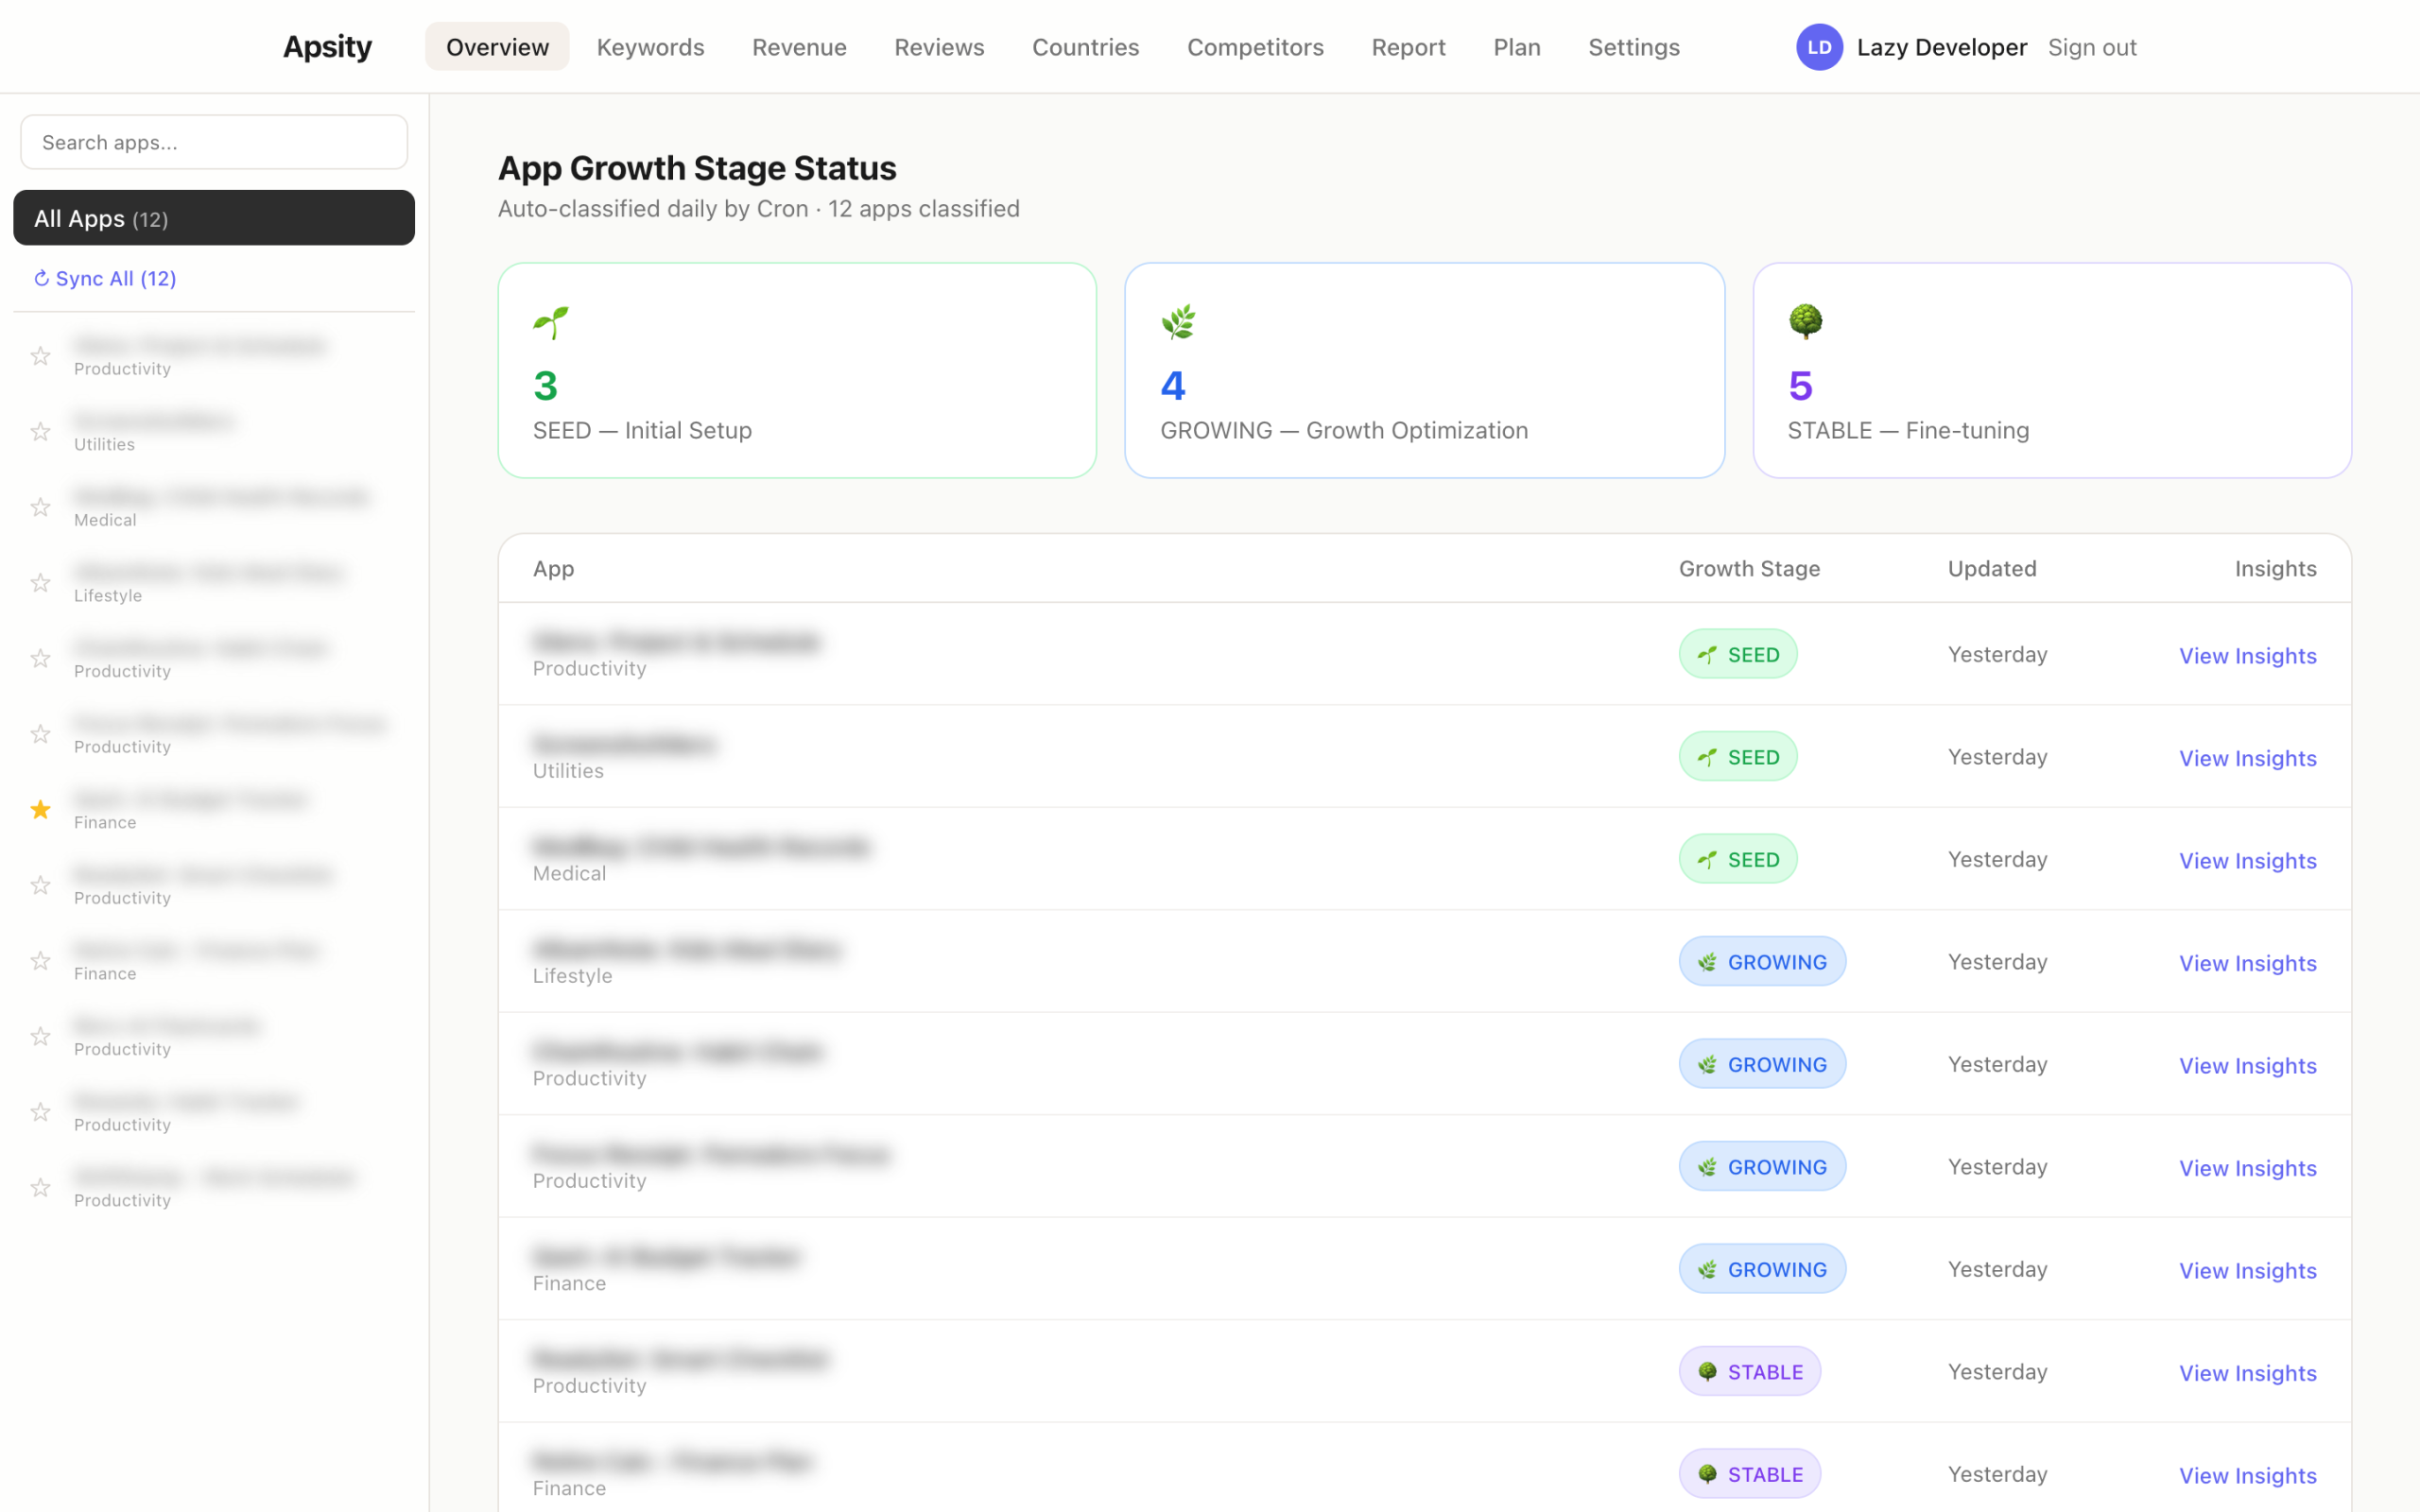
Stage detection is automatic. Every time the daily Cron runs, it evaluates each app’s data volume, download trend, and operation duration to assign SEED / GROWING / STABLE. The same app can change stages if conditions shift. If a fast-growing app suddenly drops, its GROWING-stage analysis kicks back in.
Claude reviewed my code
I tried something new this time. I had Claude review the code. Claude wrote it, but after everything was built, I said: “Review this entire codebase. Focus on things that could break in production.”
The results were more specific than I expected. It split findings into Critical and Important, with each item specifying which file and line number, what scenario would cause problems, and how to fix it. The first review surfaced 3 Critical issues.
1. MetaChange relation missing — DB save without linking relation table
2. JSON.parse unprotected — No try-catch on external API response parsing
3. Cron timeout — Timeout risk when processing 12 apps sequentially
// [Critical] 2nd Review — Key Issues
4. iTunes API rate limit — 429 risk from calling in a loop with no delay
5. Review country hardcoded — Only collecting KR, missing other countries
6. ASC data delay — Yesterday’s data may not be available at early morning
Issue 3, the Cron timeout, was the same problem from EP.02, and I already knew how to fix it with the after() pattern. Applied the same solution here. Issue 4, the iTunes API rate limit, was solved by adding a 200ms delay between requests in the loop. Issue 6, the ASC data delay, got a retry mechanism — if yesterday’s data isn’t available, try again 6 hours later.
There was a strange feeling. Code written by Claude, reviewed by Claude, bugs found by Claude, fixed by Claude. The line between what I built and what it built got even blurrier. But I’ll take that feeling over things breaking in production.
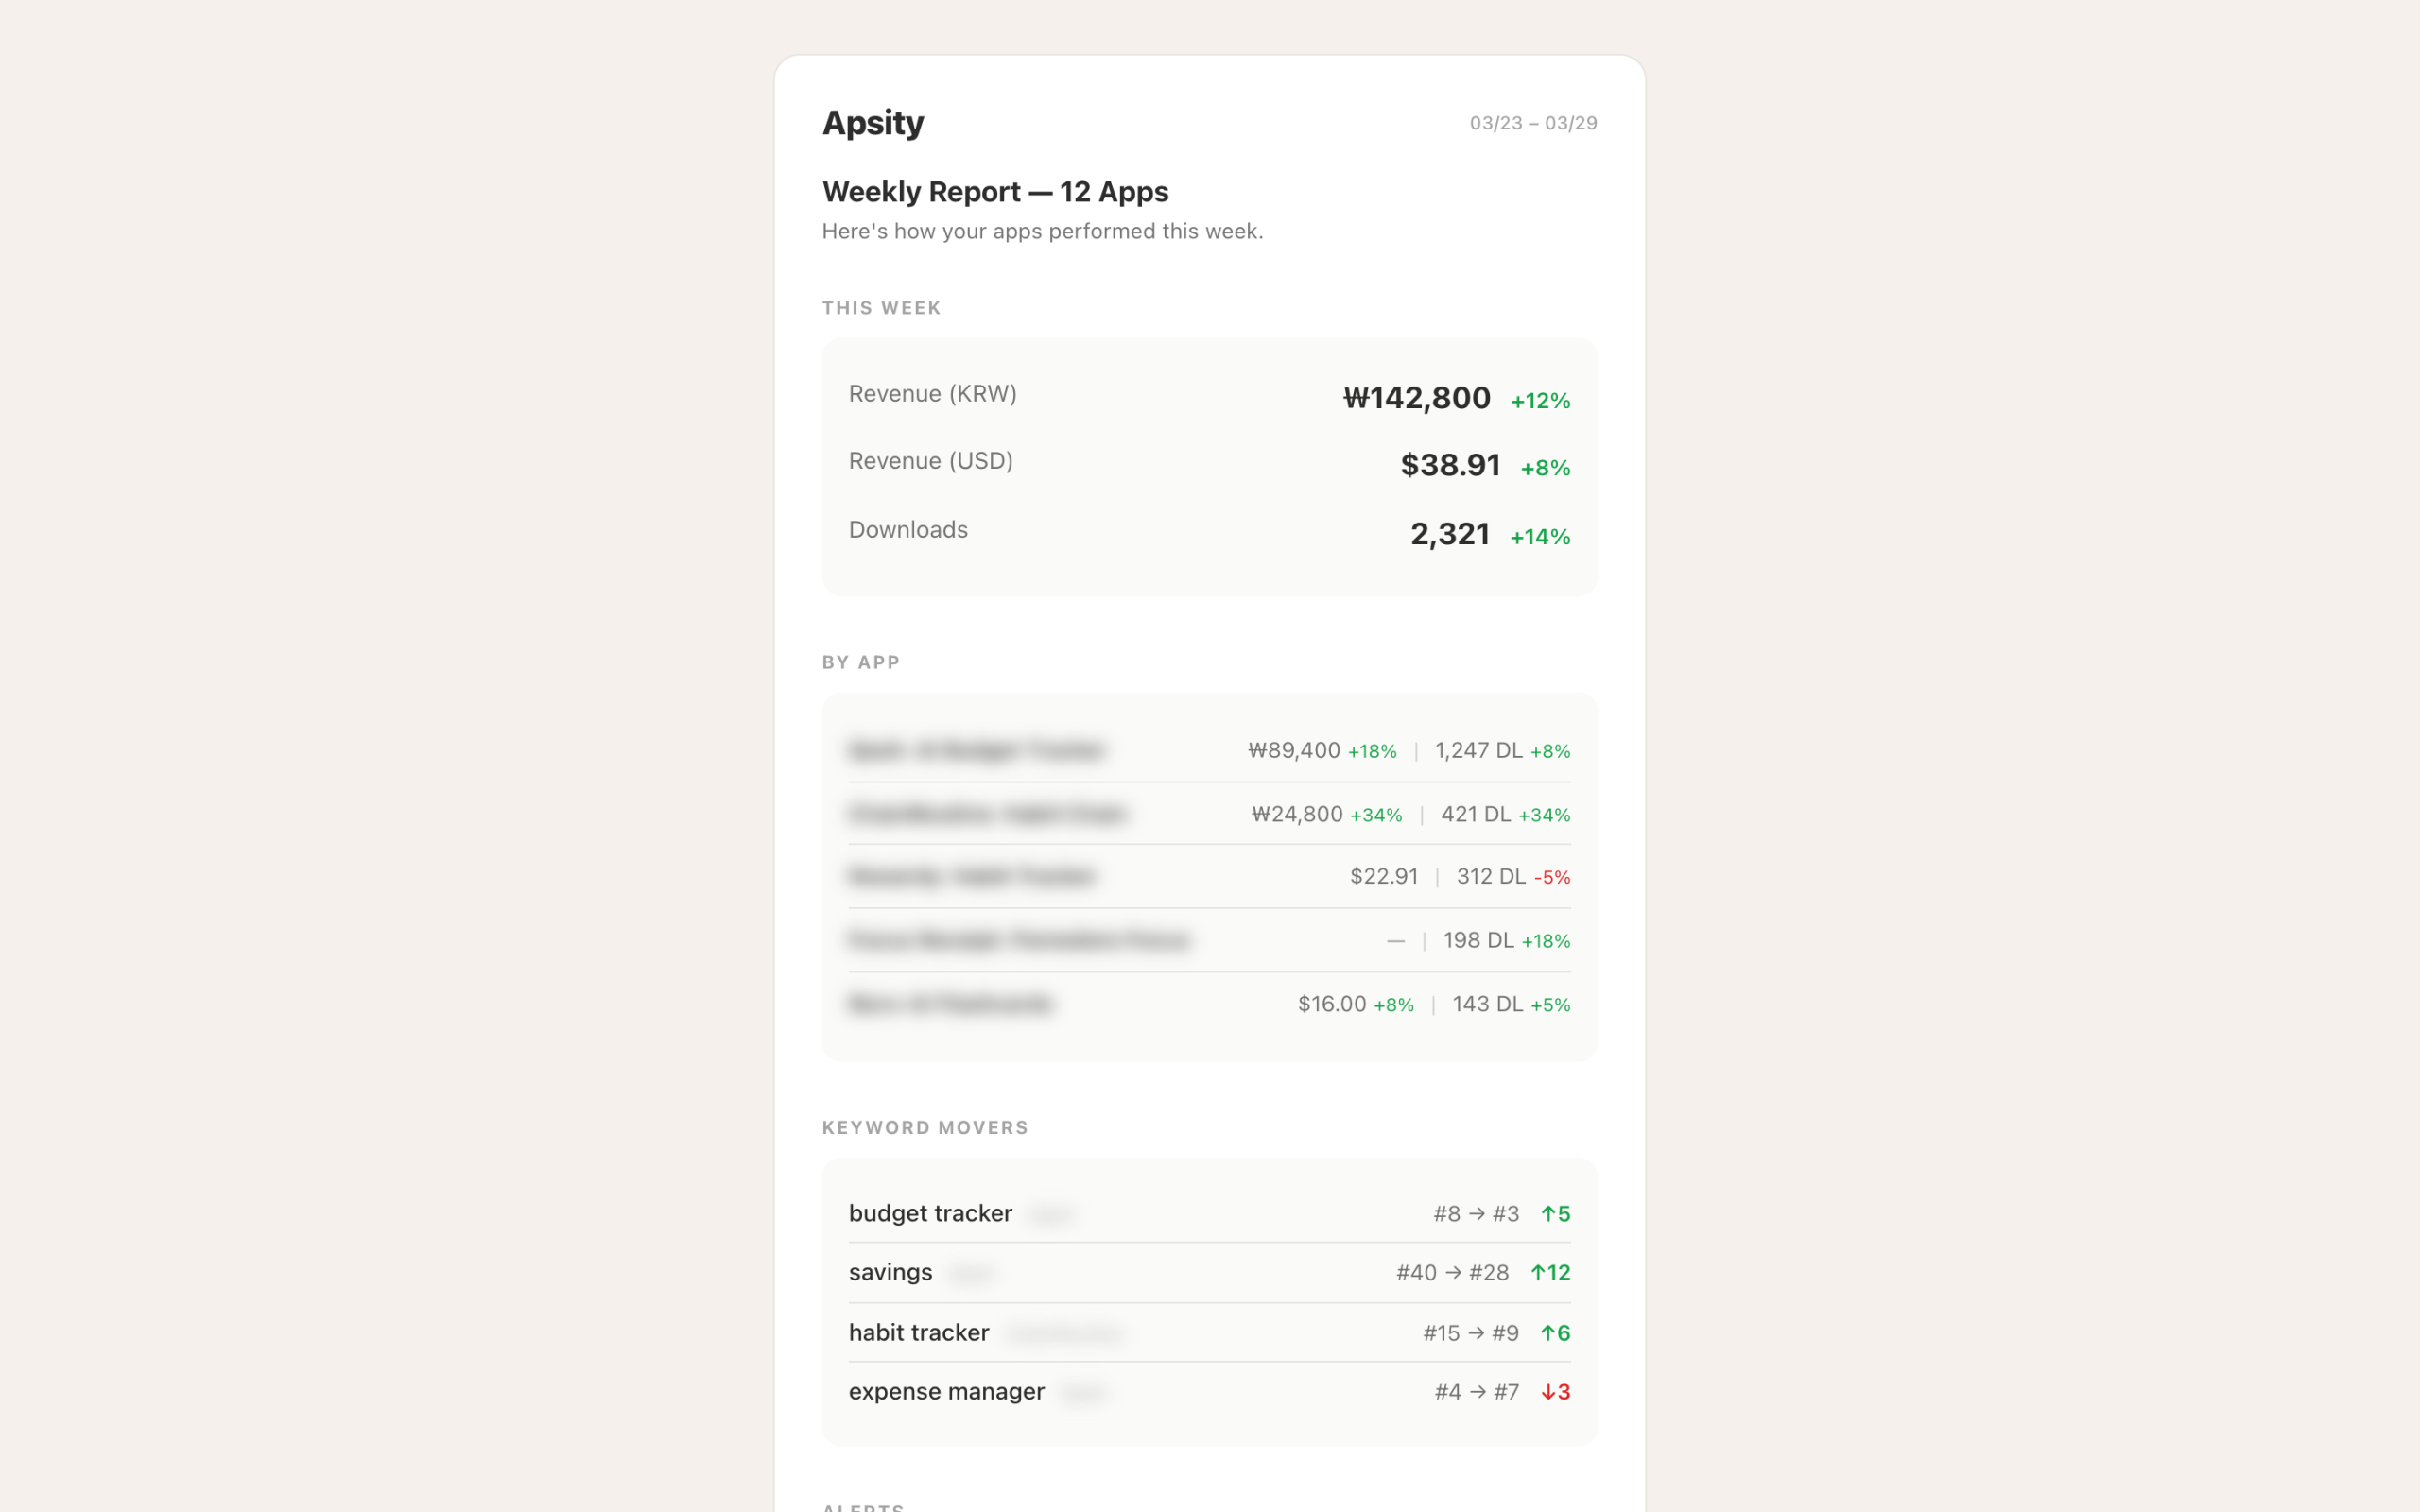
Weekly email report — a summary arriving Monday at 8 AM
Insights were being generated, but you could only see them by opening the dashboard. Don’t open it, and you miss them. I wanted Monday mornings to start already knowing how the past week went, before even opening Apsity. So I set up weekly reports to be emailed automatically.
The stack choice was simple. I looked for ways to send emails from a Next.js API Route, and the Resend + React Email combo was the cleanest. React Email lets you write email templates as React components. It avoids the inline-style hell of writing raw HTML emails.
export async function GET() {
// after() — respond immediately, process in background
after(async () => {
const summary = await weeklyDataSummary()
const topInsights = await getTopInsights(7)
await resend.emails.send({
from: ‘Apsity <report@apsity.app>’,
to: user.email,
subject: `${weekRange} Weekly Report`,
react: <WeeklyReportEmail
summary={summary}
insights={topInsights} />
})
})
return NextResponse.json({ ok: true })
}
The after() pattern shows up here again. Learned it in EP.02 when dealing with Cron timeouts. Even if email sending is slow, the response goes out immediately. No risk of hitting Vercel’s timeout.
The delivery schedule was added to vercel.json. Set for Monday at 8 AM.
{
“crons”: [
{ “path”: “/api/cron/collect”, “schedule”: “0 18 * * *” }, // 3 AM KST daily
{ “path”: “/api/cron/analyze”, “schedule”: “30 10 * * *” }, // 7:30 PM KST daily
{ “path”: “/api/cron/weekly-report”, “schedule”: “0 23 * * 0” } // Monday 8 AM KST
]
}
I settled on three things for the email content. Per-app download and revenue summary for the past 7 days, the top 3 insights (with confidence badges), and one immediately actionable item. I know that long emails don’t get read, so the goal was to fit everything on one screen without scrolling.
First run — 48 insights
I deployed the Cron and triggered it manually. 12 apps processed, total execution time 38 seconds. Rows appeared in Supabase. I checked the count. 48.
Different kinds of insights came in for each app. The finance app was STABLE, so revenue anomaly detection ran. The habit tracker was GROWING, so competitor change detection ran alongside it. A recently launched app was SEED, so only keyword auto-generation insights came through. Different stages, different insights.
One insight caught my eye. It was about the finance app. “Over the past 14 days, 3 competitors simultaneously updated their metadata for the ‘budget’ keyword cluster, and your app’s ranking for those keywords dropped an average of 8 positions since.” Confidence badge: Correlation. I clicked [View Evidence] and saw the actual dates and each app’s change history. I verified the data manually. It checked out.
Below that insight card was a keyword set with a copy button. Claude had generated it incorporating the competitive keyword changes. I copied it and pasted it into App Store Connect. Whether it’ll make a difference, I don’t know. But the flow itself — change detection, cause hypothesis, response keyword generation, copy — all happened automatically. That’s the point.
FAQ
Q. What exactly is an AI growth agent? How is it different from existing analytics tools?
Existing tools show you numbers. “Downloads down 22%.” The AI growth agent goes one step further. It proposes a hypothesis for why it dropped, shows the supporting data, and produces a ready-to-use deliverable for your response. Not “you might want to change your keywords” but “copy this text and paste it.”
Q. How do the confidence badges (Fact/Correlation/Suggestion) work?
Fact means read directly from data. Correlation means inferred from patterns between two data points. Suggestion means AI reasoning based on analysis. Facts are measured and reliable. Correlations show a relationship but not confirmed causation. Suggestions are worth trying but could be wrong. Check the badge and decide how much to trust it.
Q. Why is the indie app filter based on rating count?
Rating count correlates with downloads. Over 1,000 means significant marketing has already gone in, and indie developers shouldn’t benchmark against that. The marketing budgets and ASO strategies are different, so patterns from those apps don’t apply to indie. The 50-1,000 rating range represents apps that succeeded under similar conditions — the actual useful comparison group.
Q. How are the growth stages (SEED/GROWING/STABLE) determined?
They’re auto-detected every time the daily Cron runs. It evaluates how long data has been collected, cumulative downloads, and recent trend direction, then classifies into one of three stages. Under 30 days or fewer than 500 downloads means SEED. Rising download trend means GROWING. Over 3 months of stable data means STABLE. When the stage changes, the types of analysis change too.
Q. How was the weekly email report built?
Resend + React Email + Vercel Cron. React Email lets you write email templates as React components, avoiding inline-style hell. The after() pattern handles email sending in the background. A Monday 8 AM Cron was added in vercel.json. The email contains last week’s summary, top 3 insights, and one action item. If it’s long, nobody reads it.
Q. Can vibe coding really produce features like this?
I built it, so yes. The key is being clear about what you want. “AI diagnoses causes and produces copy-pasteable outputs” — the direction was clear. Claude structured the code and wrote most of it, but the decisions about which features were needed, ideas like confidence badges — those were mine. It’s become more about judgment than coding skill.
After the dashboard
Here’s what Apsity does now. Every day at 3 AM, data gets collected. At 7:30 PM, AI analysis runs. Monday at 8 AM, the weekly report arrives by email. Before I even open the dashboard, last week’s summary and this week’s action items are already in my inbox.
Before building this, I went to the data. Now the data comes to me and tells me what to do. Even without opening the dashboard, Monday morning already has a direction. I built it because I was lazy, and now I work less but know more. That’s the kind of system it became.
Next time something gets annoying, that’ll be EP.04.
This post was written in March 2026. Apsity is currently live, and contents may be updated.
Related: Lazy Developer EP.02 · Lazy Developer EP.01 · Cursor vs Windsurf vs Codex Comparison